Future of Gold
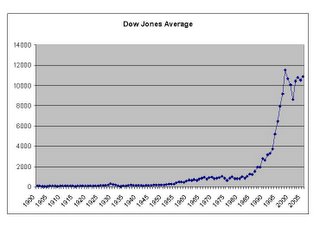
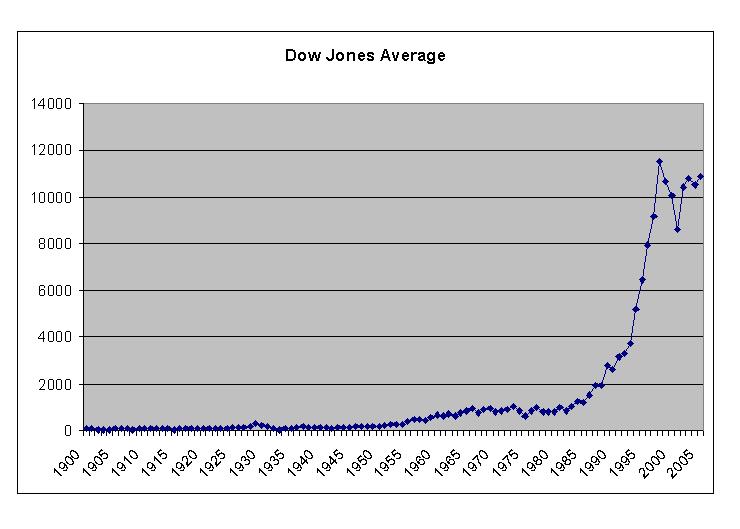
Here is an interesting observation.. as you can see, this is the historical chart of the Dow Jones Average since 1900:
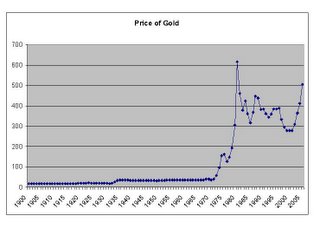
And here is a chart of the price of gold since the year 1900:
Now for the fun part.. if you go into Excel and graph the ratio of the Dow Jones Industrial Average to the historical price of gold (DJI/Gold) you get a very interesting figure:
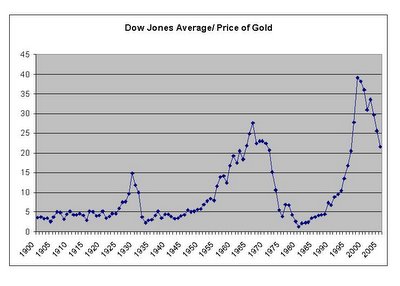
As you can see, a trend has been established. Over the years, as the stock market has risen and fallen, so has the price of gold. The important part is their relationship to one another.. the greater the ratio, the higher the Dow and/or the lower the price of gold. As the ratio gets smaller, the DJI is falling and the POG is increasing.
Why is this so important you ask?? Well, if history repeats itself (which is most likely always the case)... The Dow to gold ratio will go down. This means one thing and one thing only: The price of gold will rise as it has been for the past few years. For the ratio to hold true gold must go up.. even if the Dow continues to rise (increasing the numerator of the ratio), the price of gold has to be that much greater to maintain the ratio.
You do the math. Lets say the DJI/Gold number goes back down to 5 which it does every thirty years or so (and appears to be doing right now).. Just for the sake of example, if the Dow maintains its current level of just under 11,000 that would set the price of gold at $2000 per ounce!! If for some reason, something reaaaaaly bad happens and the stock market crashes and the Dow sees a 50% correction, that would still put the price of gold at over $1000 per ounce. The bottom line is, gold is going up. Its as plain as day. Take a look at all the gold stocks out there.. they are all doing really well.. hmm I wonder. Just a thought.
And here is a chart of the price of gold since the year 1900:

Now for the fun part.. if you go into Excel and graph the ratio of the Dow Jones Industrial Average to the historical price of gold (DJI/Gold) you get a very interesting figure:
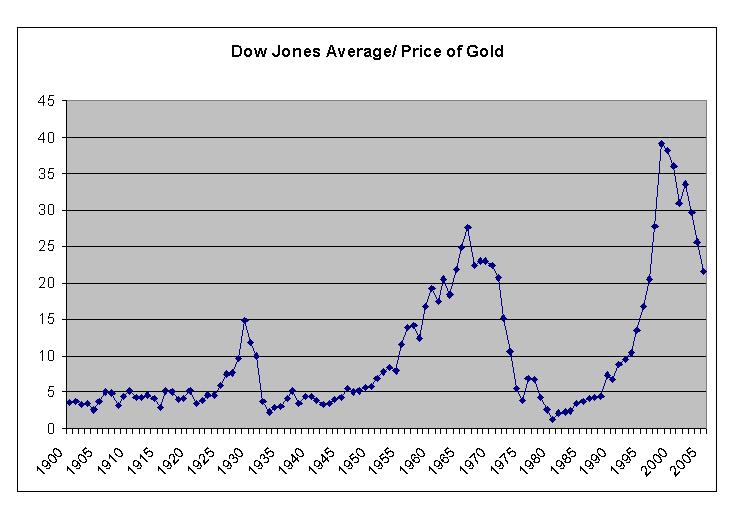
As you can see, a trend has been established. Over the years, as the stock market has risen and fallen, so has the price of gold. The important part is their relationship to one another.. the greater the ratio, the higher the Dow and/or the lower the price of gold. As the ratio gets smaller, the DJI is falling and the POG is increasing.
Why is this so important you ask?? Well, if history repeats itself (which is most likely always the case)... The Dow to gold ratio will go down. This means one thing and one thing only: The price of gold will rise as it has been for the past few years. For the ratio to hold true gold must go up.. even if the Dow continues to rise (increasing the numerator of the ratio), the price of gold has to be that much greater to maintain the ratio.
You do the math. Lets say the DJI/Gold number goes back down to 5 which it does every thirty years or so (and appears to be doing right now).. Just for the sake of example, if the Dow maintains its current level of just under 11,000 that would set the price of gold at $2000 per ounce!! If for some reason, something reaaaaaly bad happens and the stock market crashes and the Dow sees a 50% correction, that would still put the price of gold at over $1000 per ounce. The bottom line is, gold is going up. Its as plain as day. Take a look at all the gold stocks out there.. they are all doing really well.. hmm I wonder. Just a thought.
posted by crazytrader at 12:10 AM
3 comments
![]()
![]()